Using NLP: Entities and Their Relationships from Unstructured Financial Documents

Analysts in financial organizations are faced with the task of analyzing massive amounts of data in order to make critical decisions involving risk, compliance, customer experience, and investments. The problem is that the data is unstructured - it doesn’t fit into a tabular format - which means (until recently), humans needed to process it manually.
Today, analysts spend roughly two-thirds of their time, on average, collecting and understanding this data before knowing whether the information is material (Deloitte Insights). While regulatory documentation is ballooning in volume, making it even harder for humans to keep up, spurring the need to automate this analysis.
Primer has created two ready-to-use NLP Models that structure information from financial documents, making it simple to extract insights: Finance Entity Recognition and Finance Relation Extraction (FER Relex).
One of the core tasks of NLP is Named Entity Recognition (NER), which extracts entities in text and classifies them into predefined categories (companies, products/services, people, etc). When tasked with extracting insights from huge amounts of financial data, automatic entity recognition is an important first step, and then adding relationship extraction on top takes your analysis to the next level.
FER Relex, for example, can run through a document and
- identify all products that a company has, and then
- identify all revenue / financial metrics for a organization that a company might be looking for
FER Relex is great for investor portfolio analysis, and it also supports use cases outside of finance, like market research, brand awareness, competitive analysis, and risk and compliance work.
Ok, let’s put these two models together in a finance use case.
Building a financial entity extraction NLP model
The most commonly used entities in NER are people, organizations, and locations, but these categories are often insufficient for industries such as finance, medicine, or national security.
Financial analysts can’t identify entities of interest using off-the-shelf NER without retraining a specialized model from scratch to recognize finance-specific entities, which can take months if the effort succeeds.
To create our Finance Entity Recognition (“FER”) model, we arrived at six relevant entity types: Product/Service, Industry/Sector, Regulation, Financial Metric, Ticker, and Currency Amount and then trained the model accordingly.
Training an FER model: Labeling data
The most important step in building most machine learning models is acquiring a high-quality labeled dataset, and that was certainly the case here. One hundred great labels can mean the difference between a model changing the business outcome, or it just being another underperforming prototype, so we invest a lot here.
We acquired a diverse set of over 500 documents consisting of SEC filings, earnings call transcripts, and various financial news publications. The next step was to have our labeling team at Odetta.ai label occurrences of our financial entities in the text. As an aside, If you want help labeling a model, keep in mind that the same team we use to label these models is available to Primer customers!
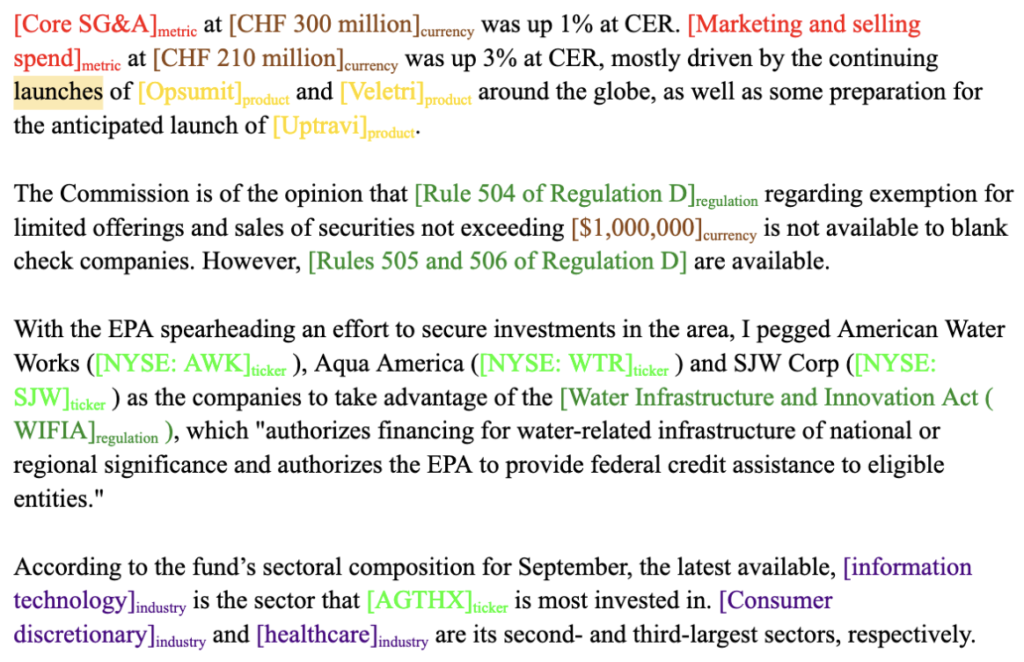
Here are are a few labeling examples:
Labeling challenges
After labeling some documents, we realized that this task, like many labeling tasks, contains inherent ambiguities. For example, we knew that “financial metrics” would cover common accounting measures like EBITDA, COGS, and EPS. However, we hadn’t considered how to parse something specific like “Joint Venture amortization of acquired above and below-market leases, net”. What should the metric be here? Just “amortization”, the whole phrase, or some other part of the phrase?
Additionally, we had to decide whether to consider generic products like “medicine” and “toothpaste”, or to include only named products. We encountered many such edge cases that experts might not agree on. We iterated on the definitions with our labeling team, and relied on inter-annotator agreement to help us identify which edge cases needed tightening.
As organizations apply NLP to their particular use cases, SMEs and data scientists need to make similar decisions in their labeling processes to ensure that models capture the most relevant information.
Training a token classification model
Entity extraction tasks are typically framed as token classification tasks. Given a text document, we first split it into tokens, which are typically words or subword strings. We then assign a label to each token. The most common token labeling scheme is called BIO (beginning, inside, outside) tagging. A token gets a “B-” prefix if it’s the first token of an entity, an “I-” prefix if it’s inside an entity, or an “O” label if it’s not part of any entity. The suffix for B and I tokens is the entity type. For example, the entity-tagged sentence

might get transformed into the following tagged token sequence
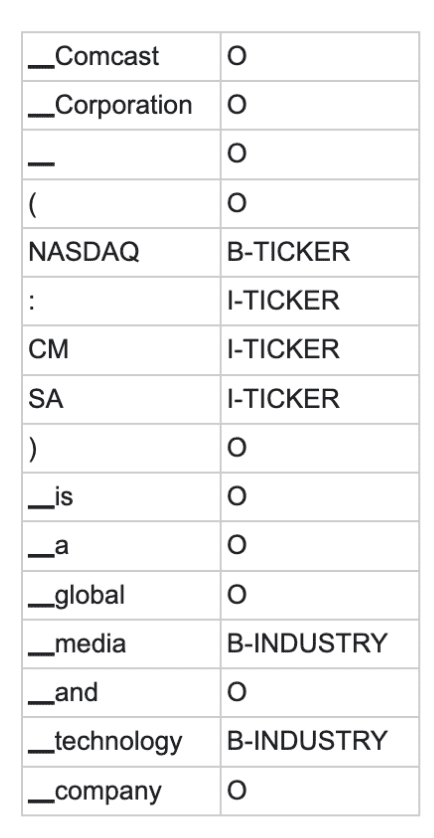
We trained our token classification model using a pre-trained XLNet transformer. XLNet was pre-trained using an improved methodology compared to BERT and performs better on a variety of tasks. It comes with an accompanying tokenizer which tokenizes text according to a fixed set of rules. The English words in our above example got a single token each, as did punctuation marks, but the ticker symbol “CMCSA” got split up into two tokens. The ▁ characters indicate whitespace before the token.
Dataset cartography
Given how crucial high quality labels are for creating a good machine learning model, we decided to see if we could improve label quality even more before training our final model. To do this, we used a technique inspired by the paper Dataset Cartography: Mapping and Diagnosing Datasets with Training Dynamics.
In the paper, Swayamdipta et al. calculated training dynamics during model training, named confidence, variability, and correctness. For a model trained over multiple epochs, confidence for a single example is the mean probability of true prediction across the epochs, variability is the standard deviation of the probability of a true prediction across the epochs, and correctness is the proportion of time the example was predicted correctly across the epochs.
The intuition is that low-confidence examples are likely to be mislabeled, and high-variability examples are often ambiguous (see Figs. 1 and 2 in the paper). If you wanted to correct mislabeled examples in your dataset, you would be best served to check the lowest-confidence examples first.
We adapted the dataset cartography technique to token classification by focusing on confidence only, and imposing a shading scheme to show which tokens the model is less confident about. In the following example, the text color indicates the label given by the annotator, and low-confidence tokens are indicated by a darker blue highlight.
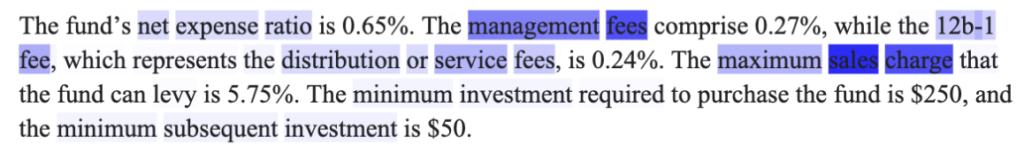
Here we see that net expense ratio and distribution or service fees are correctly labeled as metrics, and the model is very unconfident that management fees and sales charge are not entities, i.e. they should probably be labeled as metrics. This shading scheme allowed our annotators to quickly scan the documents for false negative labels, false positive labels, or labels with the wrong entity type.
Relation extraction
Extracting entities is useful, but that is just where the fun begins.
The next Engine we built using our financial entities is called Financial Relation Extraction. Relation extraction is the task of deciding what relationship, if any, exists between two given entities in a text. We incorporated the traditional Organization and Location entities of NER in order to train a relation extraction model that can answer the following questions:
- Product/Service to organization: Which company owns the product or service?
- Industry to organization: What industry does this company or organization belong to?
- Organization tolocation: Which location is this company targeting, breaking into or located?
- Currency amount to financial metric: Connect a dollar amount to the financial metric it refers to.
- Ticker to organization: Connect a stock ticker to a company name.
We labeled pairs of entities as either having one of these relations, or having no relation. The approach we used to train the relation extraction model is called Typed Entity Markers. Conceptually, the goal is to activate associations learned by a language model during pre-training by highlighting entities of interest and the concepts they represent. We focused the model’s attention on the entities of interest by wrapping each entity in the text with the “@” symbol (the “marker”) and we prepended the assigned label from the FER model (the “type”) to provide additional contextual clues. For example, consider this sentence with tags output from the FER model:

For each pair of entities in the sentence, we apply typed entity markers to obtain inputs
- @ *organization* Exxon Mobil Corporation@ is an American multinational @ *industry* oil and gas@ corporation headquartered in Irving, Texas.
- @ *organization* Exxon Mobil Corporation@ is an American multinational oil and gas corporation headquartered in @ *location* Irving, Texas@.
- Exxon Mobil Corporation is an American multinational @ *industry* oil and gas@ corporation headquartered in @ *location* Irving, Texas@.
While texts that contained many entities resulted in a large number of entity pairs to consider, we reduced the number of samples run through the model by recognizing that many entity pairs have types that are incompatible with any relation of interest. For example, sample (3) above has entity types “industry” and “location,” a pair we can label as “no relation” without any additional computation.
Once the input data was constructed for each entity pair of interest, we tokenized the text for use with a RoBERTa pre-trained transformer encoder. RoBERTa outputs vector representations for each input token, but we selected just the representations for the first “@” marker as an embedding for each entity. Those embedding vectors were passed through a classification neural network, which either assigned one of the defined relations above or the label “no relation.” Since we considered a custom list of relationships, the whole model was fine-tuned on a domain-relevant dataset.
Putting it all together, here are some examples of extracting financial entities and relationships from text. Given an input like
"As we continue to navigate the ongoing global pandemic, we continue to see a slower rate of commercialization of ANJESO than we would have expected without COVID-19, but feedback from users and our third-party market research is encouraging," said Gerri Henwood, President and CEO of Baudax Bio.
Our FER model extracts ANJESO as a product/service, the NER model extracts Baudax Bio as an organization.Then, the relation extractor determines that the relation between these two entities is Product/Service to Organization.
Here’s an example with multiple relationships:
First, in October, we amended and restated of our bank term loan, increasing the outstanding balance to $350 million from $325 million, extending the maturity to April 2024 from April 2021, and reducing the interest rates spread to 90 basis points, down from to 90 basis point, down from 95 basis point over LIBOR.
The model extracts three financial metrics: outstanding balance, interest rates, and LIBOR. It also extracts $350 million and $325 million as currency amounts, and identifies that these both refer to the same metric (outstanding balance).
These models show just a few ways that structure can be extracted from unstructured text. Many more entity types and relationships are possible. What relationships are hiding in your data?
Primer Enterprise
Informed, defensible analysis
Primer Enterprise is a secure AI platform that helps analysts and mission teams across the Intelligence Community, Defense, and Civilian agencies analyze massive volumes of unstructured data. It transforms fragmented reports, proprietary data, and open-source information into structured, traceable insight that supports faster, defensible decision-making.
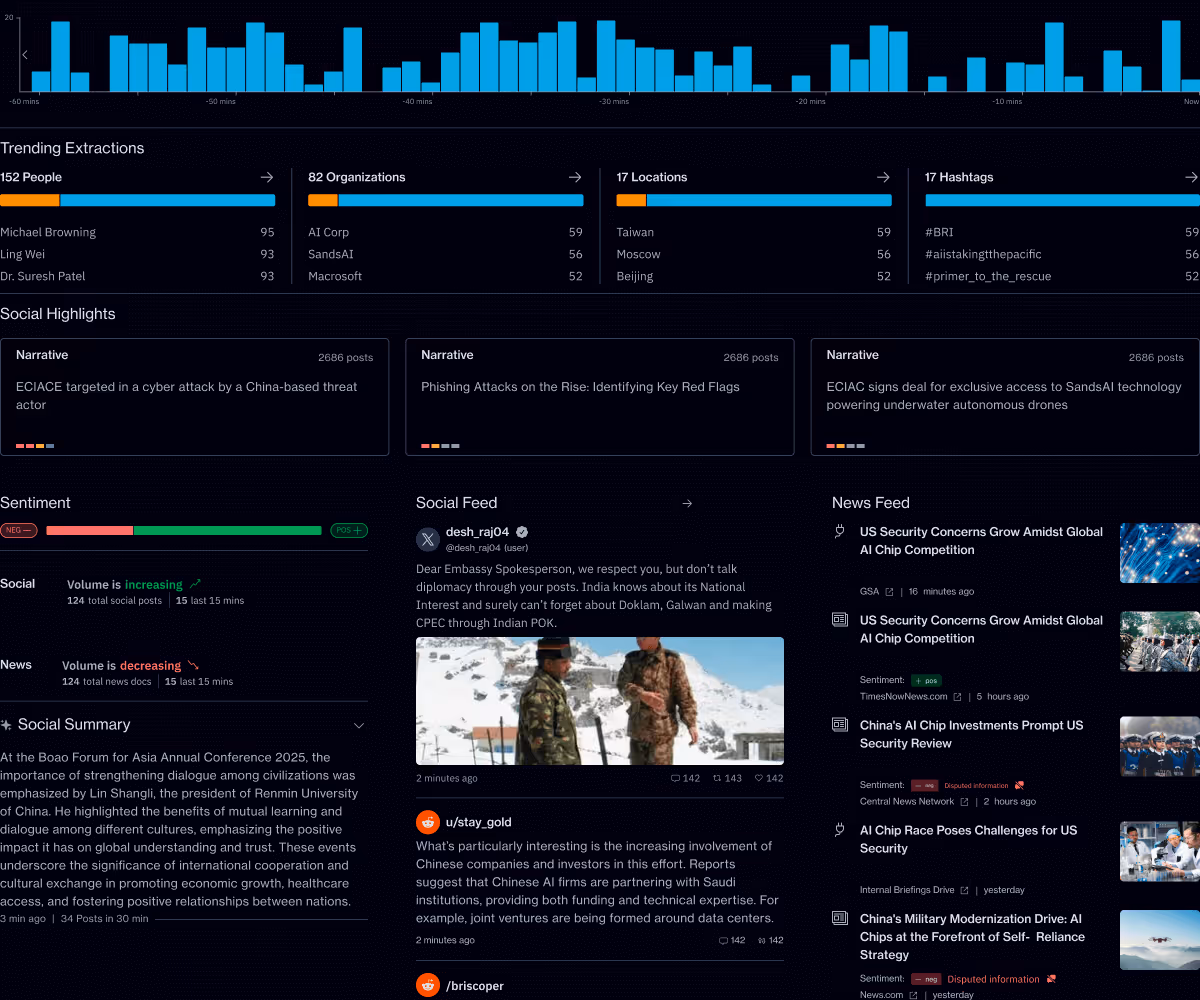
Primer Command
Real-time operational clarity
Primer Command is an AI-powered monitoring platform that helps mission teams keep track of narratives, track evolving topics, and detect emerging threats across global news and social media. It provides real-time visibility into the information environment so leaders can understand events as they unfold.